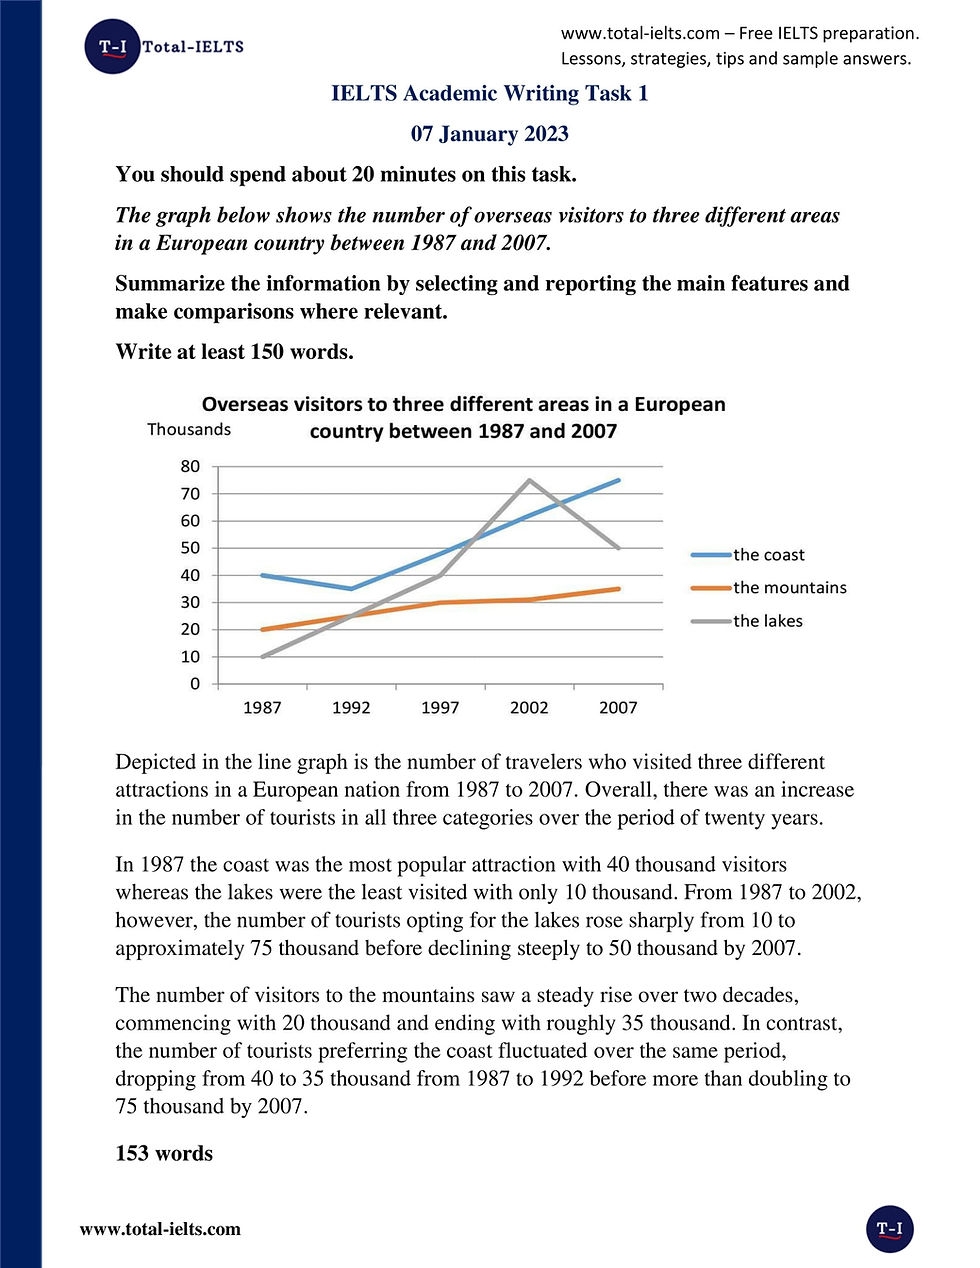
When it comes to the IELTS Writing Task 1, one of the most common types of questions you may encounter is a graph or chart that you will need to analyze and describe. This task is designed to test your ability to interpret and present data in a clear and concise manner.
Graphs can come in various forms such as line graphs, bar graphs, pie charts, tables, and diagrams. It is important to understand how to effectively analyze and present the information provided in these graphs to score well on this task.
One key tip for tackling graph questions in the IELTS Task 1 is to carefully examine the data presented and identify any trends or patterns. This will help you to organize your response and highlight the most important information in your description.
Another important aspect to consider when writing about a graph is to use a variety of vocabulary to accurately describe the data. This can include using comparisons, percentages, fractions, and other numerical expressions to effectively convey the information from the graph.
Additionally, it is crucial to provide an overview of the main trends or features of the graph in your response. This will give the reader a clear understanding of the data before delving into specific details or comparisons.
In conclusion, the graph IELTS Task 1 sample questions can be challenging, but with practice and attention to detail, you can effectively analyze and describe the data presented. By following these tips and strategies, you can improve your performance on this task and achieve a higher score on the IELTS exam.
